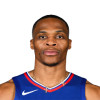
| 1 | 2 | 3 | 4 | |
| Celtics | 23 | 38 | 22 | 21 |
| Thunder | 30 | 27 | 26 | 26 |
- Summary
- Statistics
Best players
Compare
|
2025-04-09 Orlando Magic |
76:96 | |
|
2025-04-11 Charlotte Hornets |
130:94 | |
|
2025-04-13 Charlotte Hornets |
93:86 | |
|
2025-04-20 Orlando Magic |
103:86 | |
|
2025-04-23 Orlando Magic |
||
|
2025-04-25 Orlando Magic |
||
|
2025-04-12 Utah Jazz |
145:111 | |
|
2025-04-13 New Orleans Pelicans |
115:100 | |
|
2025-04-20 Memphis Grizzlies |
131:80 | |
|
2025-04-22 Memphis Grizzlies |
118:99 | |
|
2025-04-25 Memphis Grizzlies |
||
|
2025-04-26 Memphis Grizzlies |
||
| Player of the Game | |

|
EFF
36
|
| Kevin Durant | |
| Points | 37 |
| Accuracy | 10-20 |
| Rebounds | 8 |
| Assists | 2 |
| Points | |

|
37 |
| Kevin Durant | |
| Russell Westbrook | 21 |
| Kevin Garnett | 18 |
| Rasheed Wallace | 18 |
| Jeff Green | 17 |
| Rebounds | |

|
9 |
| Kevin Garnett | |
| Kevin Durant | 8 |
| Nenad Krstic | 8 |
| Paul Pierce | 6 |
| Kendrick Perkins | 6 |
| Assists | |

|
11 |
| Rajon Rondo | |
| Russell Westbrook | 10 |
| Paul Pierce | 6 |
| Kevin Garnett | 4 |
| Nate Robinson | 4 |
| Steals | |

|
5 |
| Rajon Rondo | |
| James Harden | 2 |
| Thabo Sefolosha | 2 |
| Paul Pierce | 2 |
| Serge Ibaka | 1 |
Boston Celtics
| K. Garnett |
| R. Rondo |
| R. Allen |
| P. Pierce |
| K. Perkins |
| M. Finley |
| N. Robinson |
| M. Daniels |
| G. Davis |
| R. Wallace |
| MIN | PTS | 2PM-A | 3PM-A | FTM-A | REB | AS | ST | TO | BS | EFF |
| 31 | 18 | 9-13 | 0-0 | 0-0 | 9 | 4 | 0 | 1 | 1 | 26 |
| 36 | 16 | 8-12 | 0-0 | 0-0 | 5 | 11 | 5 | 4 | 0 | 25 |
| 33 | 13 | 6-7 | 0-5 | 1-1 | 1 | 2 | 0 | 2 | 0 | 5 |
| 37 | 15 | 4-7 | 1-3 | 4-5 | 6 | 6 | 2 | 2 | 1 | 17 |
| 22 | 6 | 2-4 | 0-0 | 2-2 | 6 | 0 | 0 | 1 | 3 | 9 |
| 11 | 4 | 2-2 | 0-0 | 0-0 | 1 | 1 | 1 | 0 | 0 | 7 |
| 12 | 2 | 1-3 | 0-2 | 0-0 | 0 | 4 | 0 | 0 | 0 | -1 |
| 15 | 2 | 1-2 | 0-0 | 0-0 | 1 | 1 | 1 | 0 | 0 | 1 |
| 17 | 10 | 3-6 | 0-0 | 4-5 | 2 | 0 | 0 | 1 | 0 | 7 |
| 26 | 18 | 5-5 | 2-3 | 2-4 | 1 | 1 | 0 | 3 | 0 | 11 |
| 104 | 41-61 | 3-13 | 13-17 | 32 | 30 | 1 | 14 | 5 | 99 |
Oklahoma City Thunder
| R. Westbrook |
| T. Sefolosha |
| N. Krstic |
| J. Green |
| K. Durant |
| E. Maynor |
| N. Collison |
| S. Ibaka |
| J. Harden |
| MIN | PTS | 2PM-A | 3PM-A | FTM-A | REB | AS | ST | TO | BS | EFF |
| 33 | 21 | 9-16 | 0-1 | 3-3 | 3 | 10 | 0 | 2 | 0 | 24 |
| 22 | 7 | 3-5 | 0-0 | 1-2 | 2 | 2 | 2 | 0 | 0 | 8 |
| 35 | 6 | 2-7 | 0-0 | 2-4 | 8 | 0 | 0 | 2 | 0 | 2 |
| 39 | 17 | 4-10 | 3-4 | 0-0 | 4 | 1 | 0 | 1 | 2 | 15 |
| 44 | 37 | 8-15 | 2-5 | 15-15 | 8 | 2 | 1 | 2 | 0 | 36 |
| 15 | 8 | 3-4 | 0-0 | 2-2 | 0 | 4 | 0 | 1 | 0 | 9 |
| 13 | 6 | 2-4 | 0-0 | 2-4 | 4 | 0 | 0 | 1 | 2 | 1 |
| 13 | 2 | 1-2 | 0-0 | 0-0 | 4 | 0 | 1 | 1 | 1 | 1 |
| 26 | 5 | 1-1 | 0-1 | 3-4 | 3 | 3 | 2 | 2 | 0 | 6 |
| 109 | 33-64 | 5-11 | 28-34 | 36 | 22 | 8 | 12 | 5 | 104 |
| Time | Team | Action | Score |


